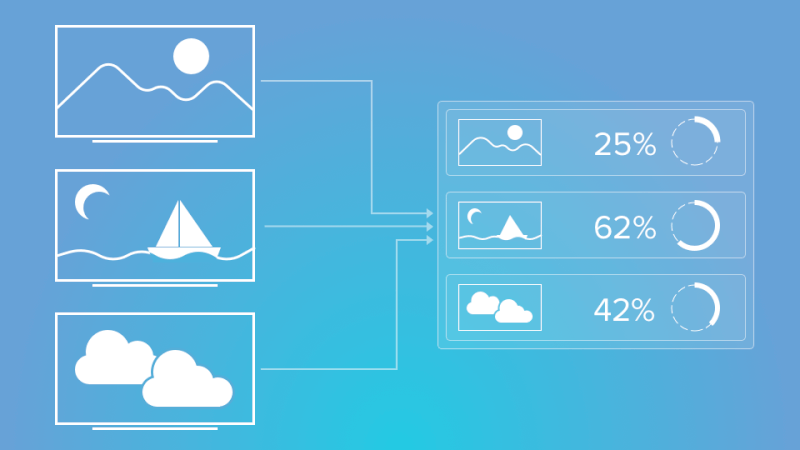
Many of our customers have requested more visibility into their content on the Graphics and Videos App. With our new Proof of Play feature, you can see exactly what content is playing, where, and for how long.
We’ve offered Proof of Play functionality in the past, but it was a very advanced feature. Now the feature is available to everyone; just contact your Enplug representative to have it enabled.
Getting proof of play for your Enplug content is simple:
- Navigate to the Graphics and Videos App in the Enplug Dashboard.
- Select the graphics and videos you’d like in the report. You can click “Select All” to include all your content.
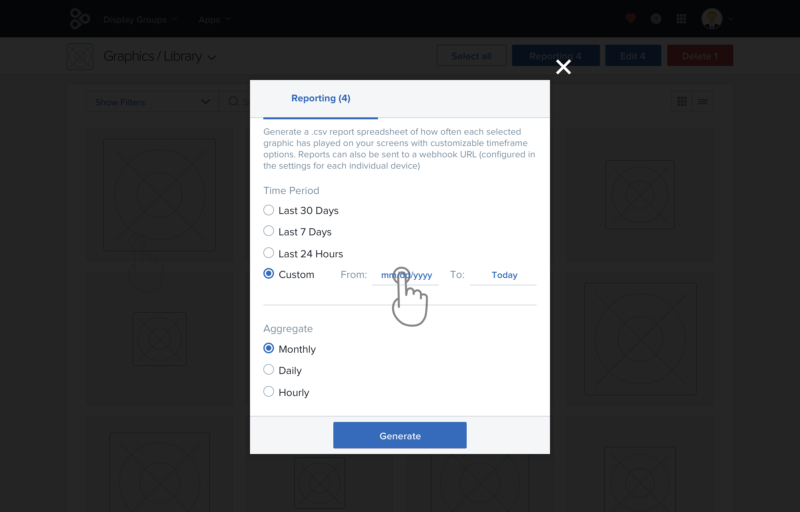
- Click the button in the upper right called “Reporting.”
- A popup will appear that allows you to customize your report. You can customize the Time Period and change how the data is aggregated.
- Time Period: What date range should be used for your data?
- Aggregate: What time interval should the data be combined into?
- Once you click “Generate,” your computer will download a .csv report with the data.
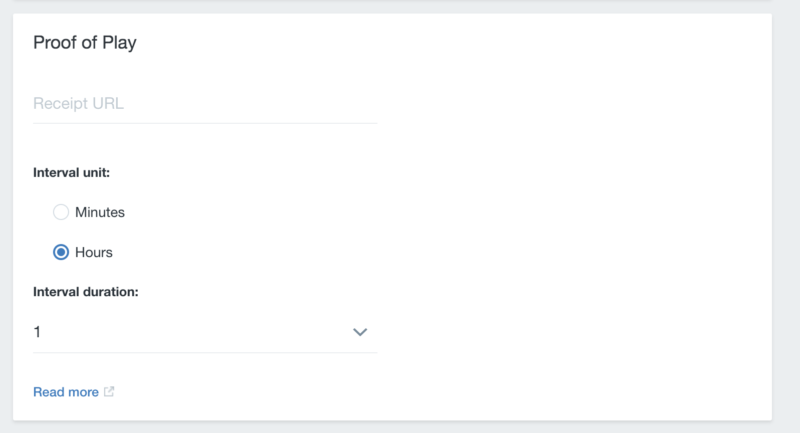
 For advanced users, you can also automatically generate proof of play data for each of your devices and send it to a webhook. To do this, you’ll need to navigate to each Display Group and input a Webhook Receipt URL in the Proof of Play section. More information here.