


Measuring digital signage ROI in venues comes down to one discipline: write down what “working” looks like before the screens turn on. A/B testing in comparable venue zones is the gold standard for isolating sales lift, but it only works when you have baseline data to compare against. Pair screen engagement metrics like dwell time and impressions with POS and operational data, and you get a number your CFO will actually trust.
Four categories of return drive every credible signage ROI calculation:
- Direct revenue: Sales lift on promoted items, basket size increases, and conversion rate changes tied to specific content windows
- Operational savings: Print cost elimination, staff time recovered from wayfinding questions, and faster campaign rollouts
- Customer experience lift: Dwell time, perceived wait time reduction, Net Promoter Score (NPS), and satisfaction survey results
- Brand and marketing value: Campaign reach, cost-per-impression versus comparable media buys, and social engagement from screen-driven moments
Each category requires its own data sources: POS reports for revenue, accounting records for print costs, survey tools for experience metrics, and proof-of-play logs for brand reach. The sections below walk through each layer in detail.
What digital signage ROI actually means for venue operators

Digital signage in venues refers to networked screens that display dynamic content, from menu boards and wayfinding maps to promotional offers and sponsor ads. ROI, or return on investment, measures the financial return relative to what you spent. The formula is straightforward: (Total Benefits minus Total Costs) divided by Total Costs, multiplied by 100.
But ROI is not the only lens worth using. Return on objective (ROO) measures whether signage achieved a specific goal, even when that goal is not purely financial. A hospital that installs screens to reduce perceived wait time is chasing ROO. A quick-service restaurant running upsell promotions is chasing ROI. Both are valid, and both require pre-defined targets to be measurable.

Without predefined success criteria before launch, measuring meaningful ROI becomes highly unreliable. Networks without targets often produce attractive engagement numbers but lack the CFO-ready spreadsheets that justify the next round of investment. The discipline of defining success upfront is what separates venues that can prove their signage works from those that simply believe it does.
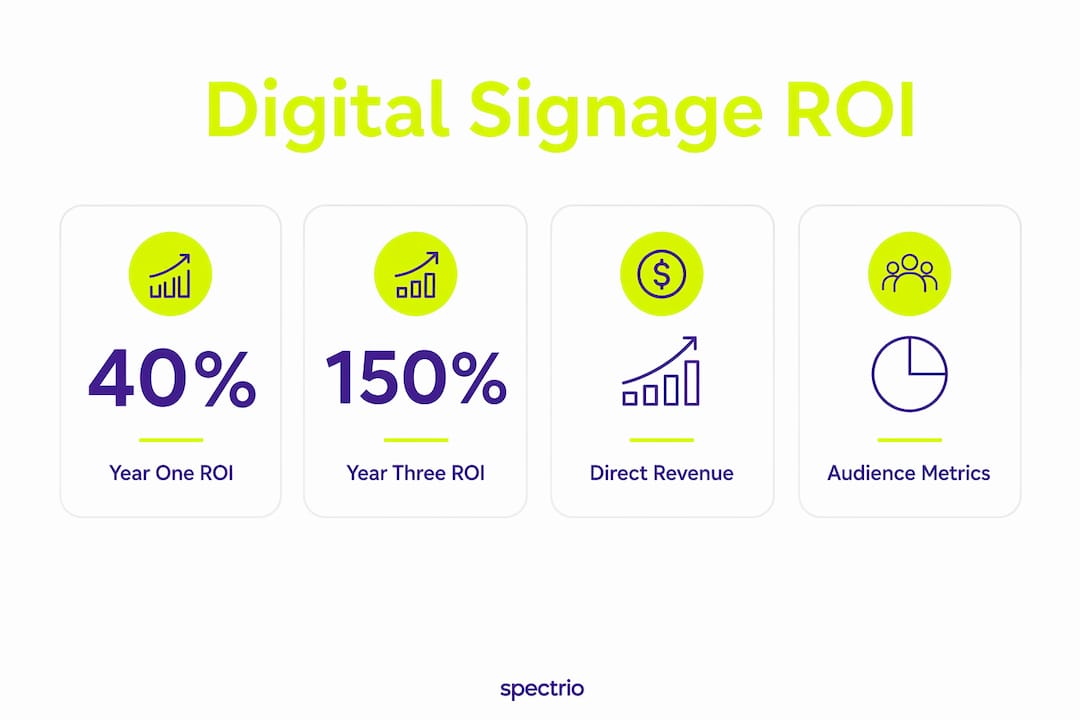
A well-run digital signage deployment returns 20–40% ROI in year one, increasing to 60–150% by year three, with retail and quick-service restaurants breaking even fastest (typically 6–12 months), while corporate and healthcare venues tend to take longer, as returns often come from operational savings instead of direct sales.
How strategic placement and content drive signage benefits
Every square foot of a venue has a job to do. Digital signage earns its keep when it is placed where guests are already pausing, deciding, or waiting. A screen buried in a low-traffic corridor generates impressions but rarely moves revenue. A screen positioned at a concession decision point, just before the register, can directly influence what a guest orders.
The core benefits venues gain from well-placed signage fall into three areas. First, sales lift: screens running promotional content at purchase decision points increase basket size and attachment rates. Second, operational efficiency: digital content eliminates recurring print costs and reduces the volume of repetitive staff questions about directions, schedules, and menus. Third, replacing printed signage with digital reduces print costs and adds 15–25% to overall ROI through operational savings.
Optimal placement zones and the content types that perform best in each:
- Entry and lobby: Welcome messaging, event schedules, and wayfinding maps that orient guests immediately
- Concession lines and food courts: Upsell promotions, combo offers, and flash deals timed to peak traffic windows
- Corridors and concourses: Sponsor content, brand storytelling, and directional information for longer dwell moments
- Near restrooms and secondary exits: Reminder messaging, next-event teasers, and merchandise prompts
- Point of sale: Last-moment upsell content, loyalty program prompts, and QR-driven offers
Dayparting, scheduling different content by time block, multiplies the effectiveness of every placement. A concession screen running a breakfast bundle at 9 AM and a premium combo at noon captures micro-moments that a static sign simply cannot. Content freshness matters too: guests who visit repeatedly notice stale screens and tune them out, which erodes both engagement and revenue impact over time.
How to align signage content with your venue’s business objectives
The content on your screens should map directly to a measurable business goal. Promotional offers drive sales lift. Wayfinding content reduces staff time spent answering directional questions. Internal communications screens improve employee awareness and reduce reliance on all-staff emails. Sponsor content generates media revenue. Each task requires a different KPI to prove it worked.
A common mistake is running a mix of content types without assigning ownership to any specific outcome. When everything is on screen, nothing is accountable. The fix is simple: before any content goes live, assign it a goal, a measurement method, and a baseline figure to compare against.
Content tasks mapped to objectives and measurement approaches:
- Promotional offers: Goal is sales lift; measure with POS data comparing promoted item sales before and during the campaign window
- Wayfinding and directories: Goal is staff time saved; measure with a pre-launch staff tally of daily directional questions, then compare post-launch
- Sponsor and partner content: Goal is impression delivery and media revenue; measure with proof-of-play logs and foot traffic estimates
- Entertainment and ambient content: Goal is dwell time and experience quality; measure with camera-based analytics or manual observation and NPS surveys
- Internal communications: Goal is message reach and staff awareness; measure with survey tools or reduced support ticket volume
Content preferences also vary by venue type. A sports arena benefits from high-energy, short-duration content timed to game moments. A hotel lobby performs better with calmer, longer-form content that informs and reassures. Matching content style to the guest’s state of mind at that location is what turns a screen from decoration into a revenue driver. For venues exploring signage as part of a broader marketing strategy, aligning content with campaign goals from the start is the fastest path to measurable results.
What digital signage actually costs, and how it affects your ROI calculation
You cannot calculate ROI without a complete picture of costs. Venues that undercount expenses end up with inflated ROI figures that fall apart under CFO scrutiny. The cost structure for a digital signage deployment breaks into two phases: upfront and ongoing.
Upfront costs include hardware (screens, media players, mounts), installation labor, software licensing for the content management system (CMS), and initial content creation. Ongoing costs include software subscription fees, hardware maintenance and replacement, content updates, and staff time for managing the network. Both phases belong in your ROI denominator.
Cost components and their financial impact on ROI:
- Hardware and installation: One-time capital expense; depreciate over the useful life of the equipment (typically 3–5 years) to spread the cost across your ROI timeline
- CMS licensing: Annual or monthly recurring cost; factor into year-one and multi-year ROI calculations separately
- Content creation: Often underestimated; include both initial production and ongoing refresh costs
- Maintenance and support: Budget for screen replacements, technical support contracts, and software updates
- Print cost savings: Count as a positive ROI component; tally the annual spend on printed menus, posters, directories, and promotional materials that digital displaces
- Staff time recovered: Assign a dollar value to hours saved from wayfinding questions, manual content updates, and printed material distribution
Most deployments break even within the first two years after launch. Retail and quick-service restaurants with menu boards often reach break-even faster than corporate, healthcare, and wayfinding deployments, which generally take longer due to returns accumulating through operational savings rather than direct sales. Running a multi-year ROI model, not just a year-one snapshot, gives a far more accurate picture of the investment’s value.
Measurement methodologies and KPIs for tracking signage ROI accurately
The most credible measurement framework combines pre-launch baseline data with controlled testing during deployment. Capture at least several weeks of pre-deployment data across every metric you plan to measure. Match that data to the same calendar period post-launch. Comparing January pre-install figures to July post-install numbers is meaningless in any venue with seasonal traffic patterns.
A/B testing by location is the gold standard for isolating signage impact. Run promoted content at half of your comparable locations and hold the other half as controls. The delta between the two groups is your attributable signage effect. Without a control group, you cannot separate signage impact from external factors like weather, competitor promotions, or seasonal demand.
Key metrics, data sources, and measurement tools by ROI category:
| KPI Category | Metric | Data Source | Measurement Tool |
|---|---|---|---|
| Direct revenue | Sales lift on promoted items | POS system | POS reports, CMS integration |
| Direct revenue | Basket size / average transaction value | POS system | POS reports |
| Direct revenue | Conversion rate | POS + door counter | POS and footfall analytics |
| Operational savings | Print costs eliminated | Accounting records | Vendor invoices, prior-year spend |
| Operational savings | Staff time saved (wayfinding) | Staff tally | Pre/post survey or shadow study |
| Customer experience | Dwell time | Camera analytics or manual count | CV-based analytics or observation |
| Customer experience | Perceived wait time | Guest surveys | QR-triggered surveys on screens |
| Customer experience | NPS / CSAT | Survey tool | Integrated survey platform |
| Brand value | Campaign reach / impressions | Proof-of-play logs + footfall | CMS logs, door counter data |
| Brand value | QR scan and redemption rate | CMS + POS | QR tracking, POS reports |
Linking screen-level engagement data to POS or CRM data is what closes the measurement loop for finance stakeholders. Knowing that 50,000 people walked past a screen tells you nothing about business impact. Knowing that 12% stopped, 3% scanned a QR code, and 1.8% completed a purchase is a story your CFO can act on. Measurement needs range from basic proof-of-play logs to advanced POS integration and demographic analytics, depending on your venue’s sophistication and budget.
Pro Tip: Run a sensitivity analysis on your ROI model. Calculate what your return looks like if the sales uplift is 10% instead of 20%. Presenting a range rather than a single number builds credibility with finance teams and protects you if results come in below the optimistic scenario.
How analytics platforms make signage performance visible and manageable
Digital signage analytics platforms provide engagement, operational, and business impact metrics that enable continuous optimization and CFO-level ROI reporting. They integrate data across impressions, conversions, and sales uplift, and they make it possible to test content variations and iterate based on real results. Without a platform pulling this data together, you are managing a media network with no ratings system.
Operational metrics come first: screen uptime percentage, playback accuracy, and content schedule compliance. These do not directly prove revenue impact, but they establish that your network is actually running as designed. A screen that is offline 20% of the time is not delivering the impressions your ROI model assumed.
Engagement metrics sit in the middle tier: impressions, dwell time, interaction rates from QR scans or touchscreen taps. These bridge the gap between “the screen exists” and “people responded to it.” They are necessary indicators, but not sufficient on their own. The business impact tier is where the real proof lives: sales uplift, conversion rate changes, average basket size, and promotion redemption rates. This is the layer your finance team cares about.
Advanced integrations take measurement further. Camera-based audience analytics can identify which content performs best with specific demographic segments, allowing venues to rotate content based on who is actually standing in front of each display. Cross-channel tracking ties the full journey together: a guest sees a promotion on screen, scans a QR code, and completes a purchase at checkout. That funnel, from screen impression to transaction, becomes a trackable event in your analytics dashboard. For venue operators who want to understand how signage ROI is tracked and attributed across different settings, integrating these tiers into a single reporting view is the clearest path to defensible numbers.
Advanced measurement practices that separate good programs from great ones
The venues that consistently prove strong signage ROI share one habit: they treat their screens like a website, not a billboard. That means testing, measuring, and iterating on a regular schedule rather than setting content once and hoping for the best.
Documenting baseline metrics well before launch is the foundation. Capture sales by product category, basket size, foot traffic, annual print costs, daily wayfinding questions, NPS scores, and dwell time over a meaningful pre-launch window. Match that window to the same calendar period you will measure post-launch. Comparing non-aligned periods invalidates ROI conclusions, particularly in venues with strong seasonal patterns like sports arenas, theaters, or retail stores.
Defining success metrics before launch is equally critical. Without predefined success criteria, networks produce attractive engagement numbers but lack the CFO-ready evidence that justifies continued investment. Write down the specific numbers that would constitute success for each content type before a single screen goes live.
Advanced tips and common pitfalls to avoid:
- Do not skip the control group: Without a comparable zone running without signage, you cannot separate signage impact from external variables
- Avoid seasonal comparison traps: A screen installed in October will look like a success by December regardless of content quality; always compare to the same period in a prior year
- Connect metrics across tiers: Isolated engagement data without POS linkage tells you nothing about business impact; build the connection before launch, not after
- Schedule quarterly content reviews: Treat signage like a website: test, measure, and swap underperforming content regularly to sustain and grow returns
- Account for operational savings in your ROI model: Print cost elimination and staff time recovered are often underestimated but constitute a meaningful share of total return
- Use dayparting to capture micro-moments: Scheduling content for specific high-traffic windows at concession lines, lobbies, and near purchase points drives measurable per-cap revenue increases
A real-world scenario illustrates how these principles compound over time. A corporate headquarters with 15 screens running internal communications and wayfinding content invested $54,000 in year one. Returns from eliminated print communications, front desk wayfinding time saved, and improved meeting room utilization totaled $51,700, putting year-one ROI at near breakeven. By year three, with setup costs paid off and operational savings continuing, cumulative ROI reached +107%. A multi-location retail deployment of 50 screens across 10 stores showed a sharper trajectory: year-one ROI of +8%, climbing to +151% cumulative by year three through promoted item sales lift, basket size increases, and eliminated print costs.
The lesson from both scenarios is that signage ROI is not a one-time calculation. Audience behavior shifts, content gets stale, and new micro-moment opportunities emerge as you learn more about your guests. Analytics-driven marketing applied consistently to your signage program is what turns a year-one investment into a multi-year compounding return. Venues that build measurement into their operating rhythm, not just their launch plan, are the ones that can walk into a budget meeting and defend every screen on the network.
For sports arenas and large entertainment venues, the opportunity is particularly clear. Micro-moment targeting at concession lines, near merchandise areas, and at entry points captures incremental revenue during the exact windows when guests are most likely to spend. Spectrio’s approach to digital signage in sports arenas covers how to map these moments to content schedules and measurement frameworks that hold up to scrutiny.
Ready to put your screens to work?
Spectrio’s Intelligent Engagement Suite™ gives venue operators and marketing teams the tools to deploy, manage, and measure digital signage with the rigor that finance teams expect. From content creation and scheduling to audience measurement and analytics reporting, Spectrio handles the full stack so your team can focus on results.
Whether you run a restaurant group, a sports facility, a retail chain, or a corporate campus, Spectrio builds measurement into the program from day one. See how restaurants use signage to drive measurable engagement and sales, or explore how to measure actual signage ROI with Spectrio’s purpose-built tools.
Key Takeaways
Measuring digital signage ROI in venues requires pre-defined goals, baseline data captured before launch, and integration of screen engagement metrics with POS and operational data to produce CFO-ready results.
| Point | Details |
|---|---|
| Define success before launch | Networks without predefined targets produce engagement data but lack the CFO-ready evidence that justifies investment. |
| Use A/B testing to isolate impact | Running promoted content in comparable zones with a control group is the gold standard for attributing sales lift to signage. |
| Track all four ROI categories | Direct revenue, operational savings, customer experience, and brand value each require distinct KPIs and data sources. |
| Year-one ROI is just the start | A well-run deployment returns 20–40% in year one and 60–150% by year three as setup costs are recovered. |
| Treat signage as a dynamic tool | Quarterly content reviews, dayparting, and ongoing A/B testing sustain and grow returns beyond the initial deployment. |
FAQ
What is the difference between ROI and ROO in digital signage?
ROI measures financial return relative to investment costs, while ROO (return on objective) measures whether signage achieved a specific non-financial goal, such as reducing perceived wait time or improving staff awareness. Both require pre-defined targets to be measurable.
How long does it take for digital signage to break even in a venue?
Most deployments break even within the first two years after launch. Retail and quick-service restaurants with menu boards often reach break-even faster than corporate and healthcare venues, which generally take longer due to returns accumulating through operational savings rather than direct sales.
What data do I need to capture before installing digital signage?
Capture sales by product category, basket size, foot traffic, annual print costs, daily wayfinding question volume, NPS or CSAT scores, and dwell time over a meaningful pre-launch window, matched to the same calendar period you will measure post-launch.
How do I prove that signage caused a sales increase, not something else?
A/B testing in comparable venue zones is the most reliable method. Run promoted content at half your locations and hold the other half as controls. The difference between the two groups is your attributable signage effect, isolated from external variables like seasonality or competitor activity.
Which venue types see the highest digital signage ROI?
Quick-service restaurants and retail venues typically see the highest year-one ROI, driven by upsells, basket size increases, and promoted item sales lift. Hospitality, healthcare, and corporate venues follow, with returns weighted more toward operational savings and experience improvements.